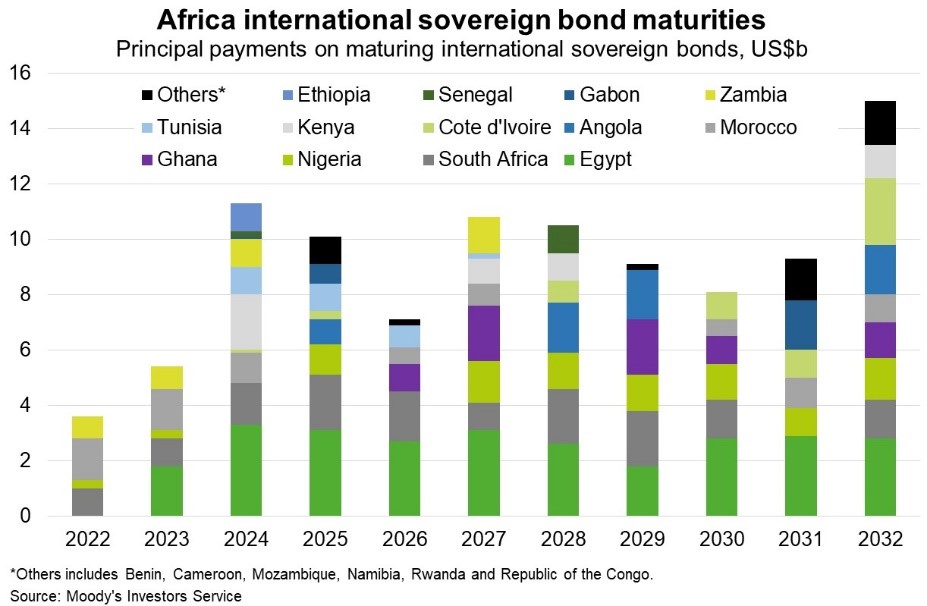
Africa—Large upcoming debt maturities raise refinancing risk
African government’s accumulation of debt in the past decade, largely from commercial international lenders and investors, is coming due in the next few years. According to Moody’s Investors Service, maturities on international sovereign bonds will hit a high in 2024 for Africa overall, and remain elevated beyond 2030 (Chart). Repayment pressures in 2024 will be highest in Kenya (US$2 billion coming due), Egypt (US$3.3 billion), Morocco (US$1.1 billion), and Tunisia (US$962 million). For Zambia and Ethiopia, which are negotiating debt relief with creditors, an additional US$1 billion due for both sovereigns in 2024 adds to financing pressures.
The region’s governments may face challenges refinancing upcoming debt amid tightening global financial conditions—reflecting rising global interest rates and diminishing access to international capital markets. The lingering effects of the pandemic and rising energy and food prices linked to the Russia-Ukraine crisis are weighing on GDP growth, increasing inflation and raising risks of social unrest.
Such factors constrain government revenue generation while increasing social spending pressures, delaying fiscal consolidation and further exacerbating financing challenges. The need for governments to make higher debt service payments in coming years will also reduce room for public spending on much-needed physical and social infrastructure to raise GDP growth. Many African countries face “economic scarring” from the pandemic; the IMF’s pre-pandemic forecasts for Sub-Saharan Africa pointed to 3.9% average annual growth over the five years to 2024. Now, including the realised pandemic-induced downturn and recovery of 2020 and 2021, the IMF’s April 2022 World Economic Outlook forecasts lower average growth of 3% per year over the five years to 2024.
Financing challenges and lower economic growth could curb opportunities to expand Australian exports to Africa from their 2020-21 amount of $4.3 billion (1% of Australia’s total exports).